018 - 26th June 2024
This week we have our first submission from the Community - Colin Mazengarb gives us the lowdown on Mixed Format Labels! #
Hints and Tips #
Mixed Format Labels for dummies! by Colin Mazengarb #
Recently I wanted to try the mixed format labeling capability that North Road developed in 2022 for QGIS 3.28 and outlined in this post: Mixed Format Labels in QGIS — coming soon! – North Road.
This appears to be the only documentation I can find and not being proficient in HTML it took some experimenting for me to get more complex code working consistently. I suspect I am not the only one who struggled with this so in the spirit of sharing here is my learning. More importantly this will also provide content for Em and make me feel less guilty at the same time!
Mixed format labels enables a mixture of fonts, colours, sizes, etc for a given label expression, something that cannot be done in the standard labeling engine. Warning: the workflow is a little complicated but hopefully my examples and notes will get you started.
The easiest step is to Allow HTML formatting in the Text properties section as shown in the following screen grab. This is also the easiest thing to forget to do as well and leave you wondering why all the HTML code is appearing in the label yet the preview looks OK!!
The following screenshot and code has the first line in the default text format and the second line a reduced font size and red colour.
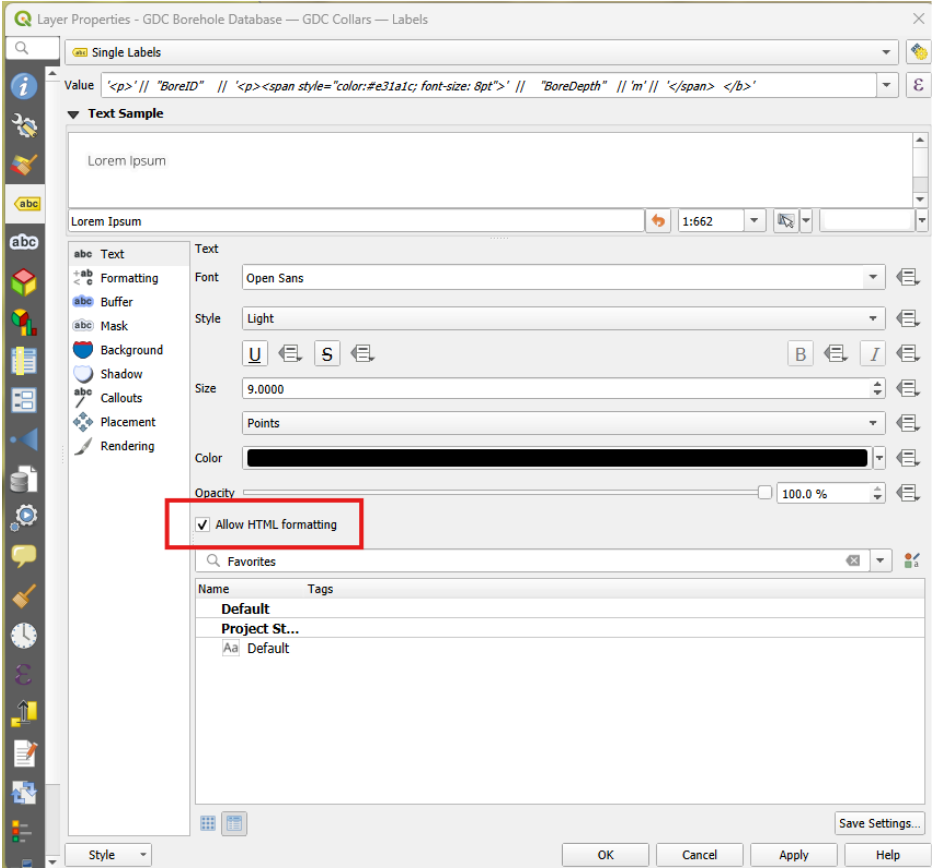
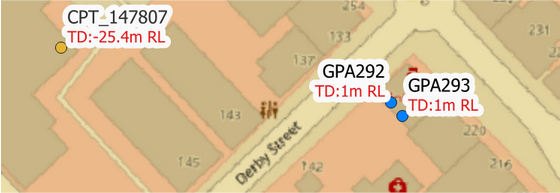
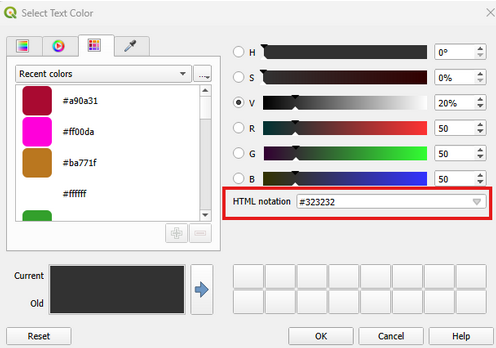
The syntax for HTML formatting in QGIS label expressions requires a change of code from a standard expression as shown in the following example. In this example BoreID takes the default label settings, BoreDepth is on a new line and is red with a different font size from the default font. The colour code can be copied from the palette in QGIS as shown in the screen grab.
'<p>' ||  "BoreID"    ||  '<p><span style="color:#e31a1c; font-size: 8pt">'  ||    round("BoreDepth", 1)   || 'm' ||  '</span>
</b>'
Notes:
- Start each label expression with the
‘<p>’text - Replace the QGIS new line code
/nwith‘<p>’ - Some text properties can be defined by regular HTML tags that are paired at the beginning and end as follows:
- bold:
‘<b>’|| …….||’</b>’ - italics:
‘<i>’ || …….||’</i>’ - underline:
‘<u>’ || …….||’</u>’ - strikethrough:
‘<s>’ || …….||’</s>’
- bold:
- Other font properties may require the use of CSS (Cascading Style Sheets) notation as outlined below and in my borehole example above.
- Font families:
‘<span style=”font-family: Comic Sans MS”>’ || …….||’</span>’ - Font weights:
‘<span style=”font-weight: Comic Sans MS”>’ || …….||’</span>’ - Font color:
‘<span style=”color: #rrggbb’ || …….||’</span>’(copy the colour code from the colour palette) - Font size:
‘<span style=”font-size: 30pt”>’ || …….||’</span>’
- Font families:
- If multiple properties (such as colour and size) for a text block are required, then separate each property with a colon as shown below
‘<span style="color:#e31a1c; font-size: 8pt">’ || …….||’</span>’
- Some properties can be defined either as HTML or CSS tags:
- Bold, italics, underline, strikethrough.
- Functions such as round can be inserted in the normal manner as shown in the example above.
I am hoping this is helpful and a big thanks to the North Road team and their sponsors for developing an amazing capability.
QGIS AU News #
Busy times abound. Help is needed to organise the QGIS User Conference if you are able to.
QGIS Project News #
QFIELD new release #
This new release is bumper chock-full including:
- A new drawing tool to sketch or annotate (funded by the Swiss QGIS user group)
- Copy and paste vector features
- Feature form imrpovements
- UX improvements for information panels and dashboards
- New Plugin Framework Read more about it here.
Regional News #
Emory Beck, from Aotearoa and known for his 3D rendering work, was one of the most popular talks at last year’s FOSS4G SotM Oceania NZ, check out his latest blog on (Relief Series - National/Forest Parks)[https://www.maphustle.co.nz/blogs/relief-series].
Not QGIS but related…somewhat #
For those lovers of patterns - get yourself lost in this music video by Weval, an electronica band out of The Netherlands. One word that we all love - Patterns- watch Someday - put it full screen, darken the room and hit play. No distractions for 4.5 minutes. Caution for those who have health issues impacted by photosensitivity.
Support Disaster relief mapping #
- Flood mapping for Afghanistan, DRC and Brazil
- Landslide mapping for Enga Province, PNG
- Kanlaon Volcano in the Philippines
- Libya mapping project
Check out the HOTOSM Tasking Manager to get started.
EVENTS #
QGIS Open Day tomorrow night! 28th June - more information to come.
Brisbane Geospatial Network 1st Wednesday of the Month
Brisbane GeoRabble 9th July, Charming Squire
QGIS User Conference, Bratislava, Slovakia: 9-10th September
2024 QGIS AU User Conference, Hobart: 4th November
FOSS4G SotM Oceania 2024 Hobart: 5-8th November
Everything Open 2025, Adelaide: 20-22 January 2025
GCA’s Locate will be in Brisbane next year around May.
2025 QGIS AU User Conference, Norrköping Sweden: early June
**2025 FOSS4G Conference, Auckland Aetearoa New Zealand: November
***Check the Events for more information. ***
Newsletter Content #
Finding these emails boring and want to contribute some content? You can provide an interest story, a report on an event or a technical instruction. Head to the Content Contribution form to fill in your contribution. We will then contact you to run through the contribution.